In this article (5 sections)
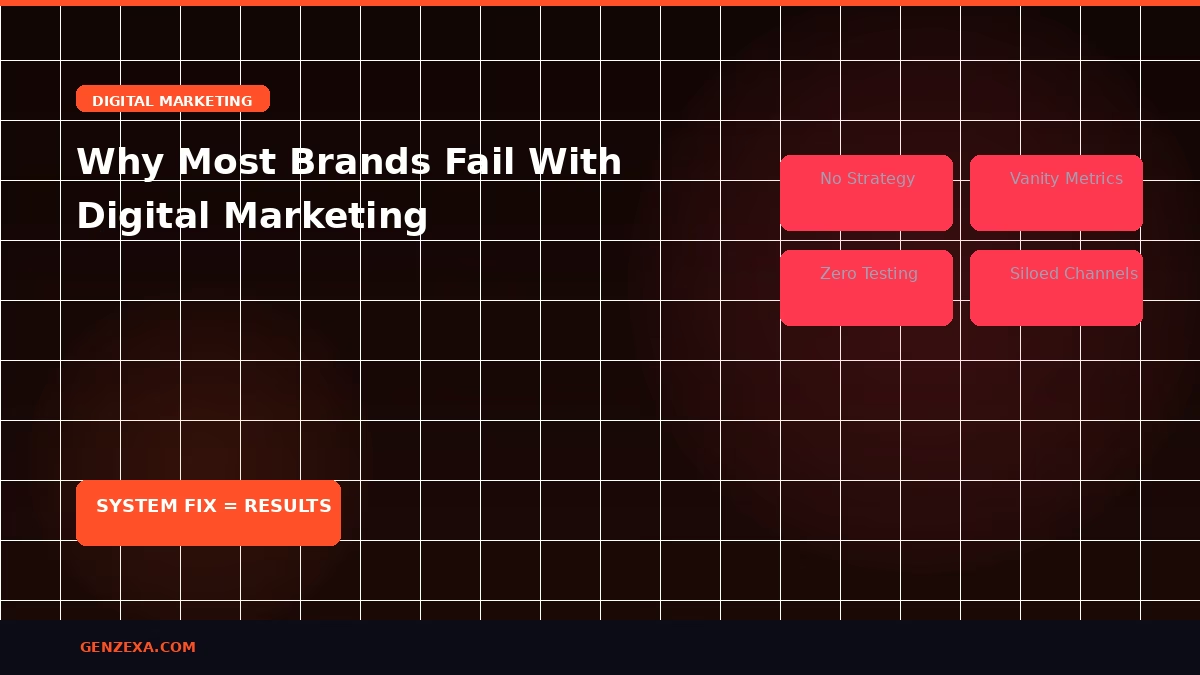
Vanity metrics are the most expensive habit in marketing. Impressions, reach, follower counts, they feel like progress and produce very little revenue. The brands that scale consistently have made a different choice: they track the metrics that connect directly to business outcomes, and they make every major decision through that lens.
This guide covers every KPI that matters, what each one means, how to calculate it, and what your numbers are actually telling you about the health and scalability of your marketing system.
Why Most Brands Track the Wrong Metrics
Vanity metrics are seductive because they're usually large, they grow with any marketing activity, and they feel like validation. But they share one critical flaw: none of them have a direct, reliable relationship with revenue.
A post with 50,000 impressions that generates zero purchases has a worse ROAS than a post with 500 impressions and 10 conversions. Yet most marketing reports would celebrate the first and barely mention the second. This is how brands convince themselves their marketing is working while revenue stagnates.
The only marketing metrics worth optimizing are the ones with a direct causal relationship to revenue. Everything else is context at best, distraction at worst.
Acquisition KPIs: The Cost of Bringing Customers In
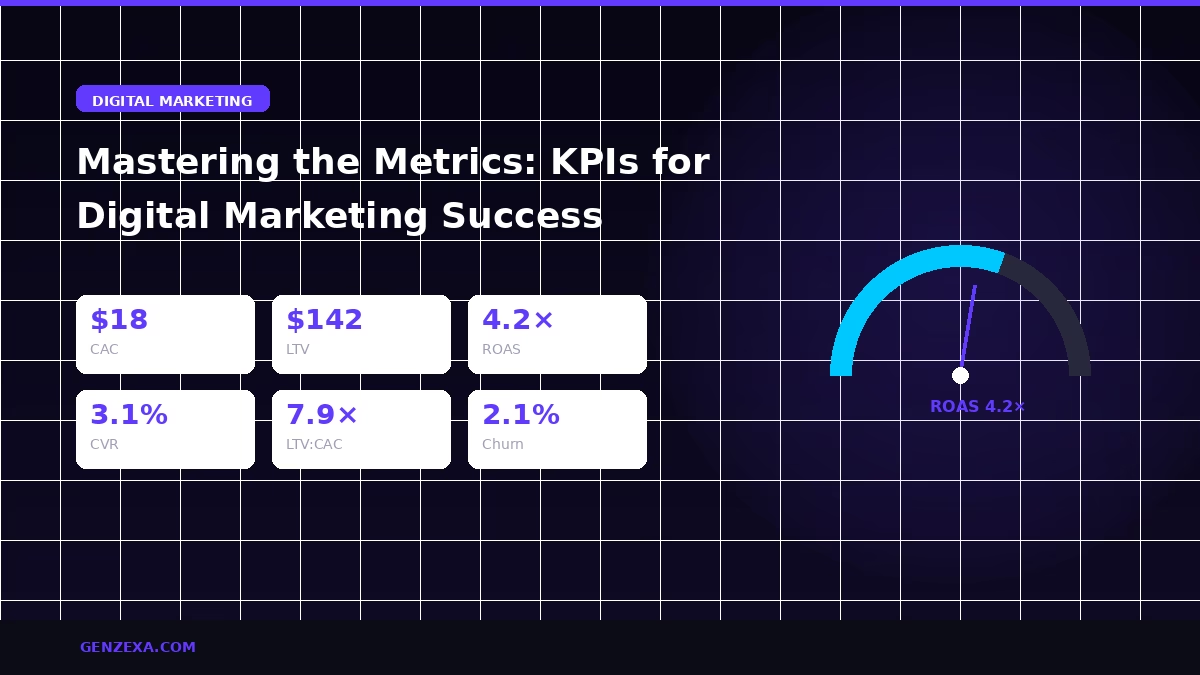
CAC, Customer Acquisition Cost
Definition: Total marketing and sales spend ÷ number of new customers acquired in the same period
Why it matters: CAC tells you the fundamental economics of your acquisition strategy. If CAC exceeds what a customer is worth to you over their lifetime, the business model is broken, no amount of top-line growth will fix it
Benchmark: CAC should be less than 33% of LTV (i.e., LTV:CAC ratio of 3:1 or better)
ROAS, Return on Ad Spend
Definition: Revenue generated from ads ÷ total ad spend in the same period
Why it matters: ROAS tells you the direct return on your advertising investment. It should be tracked at the campaign level, not just overall, a 4× blended ROAS can hide a 1× cold campaign being subsidized by an 8× retargeting campaign
Benchmark: 3–5× ROAS minimum for most eCommerce product categories. Less than 2× typically indicates a conversion problem, not a traffic problem
CPL, Cost Per Lead
Definition: Total ad spend ÷ number of leads generated
Why it matters: The primary metric for lead generation campaigns. Must be contextualized by lead quality, a $5 CPL is worse than a $20 CPL if the cheaper leads never convert
Benchmark: Highly variable by industry. For B2B SaaS: $15–$40. For eCommerce lead gen: $3–$15. Compare against your lead-to-customer conversion rate to calculate effective CPA
CTR, Click-Through Rate
Definition: Clicks ÷ impressions × 100
Why it matters: CTR measures creative relevance and audience fit. Low CTR means the creative isn't resonating with the audience it's reaching. High CTR with low CVR means the ad over-promises what the landing page delivers
Benchmark: Google Search: 5–10%. Meta Ads cold: 1–3%. Display/remarketing: 0.3–0.8%
Conversion KPIs: The Efficiency of Your Funnel
CVR, Conversion Rate
Definition: Conversions ÷ total visitors × 100
Why it matters: CVR is the most direct measure of how well your landing page, product page, or checkout flow is working. A 1% improvement in CVR has the same revenue impact as a 100% increase in traffic
Benchmark: eCommerce: 1.5–3.5%. SaaS free trial: 2–5%. Landing page lead capture: 3–8%
AOV, Average Order Value
Definition: Total revenue ÷ total number of orders
Why it matters: Increasing AOV improves profitability without increasing acquisition cost. Even a 10% AOV increase can meaningfully improve ROAS across an entire product catalog
How to improve it: Product bundles, upsells at checkout, free shipping thresholds, and "frequently bought together" recommendations
Cart Abandonment Rate
Definition: (Carts created − purchases completed) ÷ carts created × 100
Why it matters: Industry average is 70–75%. Every percentage point below average is direct revenue recovered. Cart abandonment email sequences targeting this metric typically deliver the highest ROI of any email program
Retention KPIs: The Long-Term Health of Your Business
LTV, Customer Lifetime Value
Definition: Average purchase value × average purchase frequency × average customer lifespan
Why it matters: LTV determines the maximum sustainable CAC for your business. Improving LTV, through better retention, higher AOV, and increased purchase frequency, directly unlocks the ability to spend more on acquisition than competitors can
Repeat Purchase Rate
Definition: Customers who bought more than once ÷ total customers × 100
Why it matters: The single most actionable retention metric for eCommerce brands. A 5% improvement in repeat purchase rate typically improves overall revenue by 10–15% because of the compounding effect on LTV
Benchmark: Healthy eCommerce: 25–40%. Under 20% suggests a product, experience, or retention marketing problem
Churn Rate (SaaS)
Definition: Customers lost in a period ÷ total customers at the start of that period × 100
Why it matters: Monthly churn of 5% means you lose 46% of your customer base in a year. Even reducing churn by 1–2% can double the long-term value of a SaaS business
Benchmark: B2B SaaS: under 3% monthly. B2C SaaS: under 5% monthly
The Most Important Ratio in Marketing: LTV:CAC
If you track only one metric, track this one. LTV:CAC is the ratio of how much a customer is worth to your business over their lifetime versus how much it costs to acquire them.
- LTV:CAC below 1:1, You're paying more to acquire customers than they're worth. This is a business model problem, not a marketing problem
- LTV:CAC of 1:1 to 2:1, Marginally unprofitable or breakeven. Every tactical improvement matters significantly at this ratio
- LTV:CAC of 3:1, Healthy and scalable. The business can invest confidently in growth
- LTV:CAC of 5:1 or higher, Strong competitive position. Either scaling aggressively or testing new acquisition channels is appropriate
Every other metric in this guide exists to help you move this ratio in the right direction. Track them all. Use them to diagnose. Use LTV:CAC to evaluate.
Reading about it is step one. We can do it for you.
Tell us what you sell and what's holding sales back. We'll tell you straight if we're the right people to fix it.
See how our services work →