In this article (6 sections)
Some case studies are impressive. This one is instructive. Because every decision made in this six-month transformation is documented here, including the ones that didn't work initially and required adjustment. This is what a real brand turnaround looks like when it's driven by system and data rather than hope.
This is one of several clothing brands we have helped grow, each with its own starting point. For a separate brand that went from $5,000 to $120,000 a month, read this clothing brand case study, or see our apparel case study.
The Starting Condition: Month 0
When the brand approached GenZexa in early 2024, the situation was discouraging on paper but filled with untapped potential:
- Monthly revenue: $15,000, flat for 4 consecutive months
- ROAS: 1.1×, effectively losing money on every ad dollar after costs
- Email list: Zero flows, zero automations, zero list-building strategy
- Retargeting: Completely absent, 97% of site visitors left without any follow-up
- Ad strategy: Broad audience targeting, single creative, no testing framework
- Website conversion rate: 0.8%
The product was genuinely good. The aesthetic was strong. The brand had a real customer base with a real reason to exist. What it lacked was everything surrounding the product, the infrastructure that turns a good product into a scalable business.
Month 1: Build the Foundation
Shopify CRO Rebuild
The website was the first priority, because sending more traffic to a 0.8% converting site would only scale losses. We rebuilt the core conversion architecture:
- Rewrote every product page headline to lead with outcome and lifestyle benefit, not product name
- Added size-confidence tools and fit guides to every product page, reducing the number one purchase barrier for apparel
- Implemented lazy-loading video on the hero section, showing products worn in real environments
- Simplified the checkout to a single-page flow with Shop Pay and PayPal one-click options
- Added 140+ customer reviews with photo verification across all major product pages
Klaviyo Email Infrastructure
Six core automated flows were built and launched in month one:
- Welcome series (5 emails over 8 days): brand story, bestsellers, social proof, first-purchase offer
- Abandoned cart (3 emails: 1hr, 24hr, 72hr): reminder, size-confidence message, final offer
- Post-purchase (4 emails over 21 days): thank you, UGC request, complementary product recommendation, loyalty enrollment
- Win-back (3 emails at 45/60/75 days inactive)
- Browse abandonment (2 emails)
- Back-in-stock notification
The welcome flow converted at 4.2% on first deployment, generating $3,200 in month one from email alone.
Tracking and Attribution Fix
Before this rebuild, the brand had no reliable attribution data. Pixel tracking was broken. Google Analytics was configured incorrectly. No decisions could be made with confidence. We fixed every tracking issue before scaling a single ad.
Months 2–3: Launch, Test, and Find the Winners
Meta Ads Creative Strategy
We launched 12 creative variants across four formats in month two:
- Lifestyle video ads (product worn in real environments by real people)
- UGC-style testimonial videos (unboxing + first wear reactions)
- Problem-led static ads ("Finally, [pain point addressed]")
- Social proof carousels (reviews with product photos)
By Week 3, three clear winners had emerged from the data: two UGC-style videos and one lifestyle video featuring a specific hero product. These three creatives were scaled from $100/day to $800/day combined. All nine underperformers were paused without hesitation.
Audience Refinement
Cold audience testing revealed that the brand's actual best customers were 6 years older than originally assumed, concentrated in three specific metro areas, and had strong overlap with two competitor interest segments. Targeting was rebuilt around this discovered ICP rather than the assumed one.
Months 4–6: Scale and Retain
Google Shopping
With Meta proving profitable, we added Google Shopping to capture purchase-intent search traffic. Smart Shopping campaigns targeting the brand's three bestselling SKUs delivered 5.1× ROAS in month four, outperforming initial Meta campaigns.
TikTok Ads
TikTok was introduced in month five as a TOF channel to reach a younger demographic and generate UGC-quality content at scale. Micro-influencer partnerships (5K–50K followers) provided native-feeling creative that outperformed brand-produced content 6 out of 8 times in A/B tests.
Loyalty Program Launch
A tiered loyalty program was introduced in month five with three levels based on cumulative spend. Enrollment incentive: double points on the first purchase post-enrollment. Result: 38% of existing customers enrolled within 30 days. Repeat purchase frequency increased from 1.3× to 2.1× per year.
Month 6 Results vs. Month 1
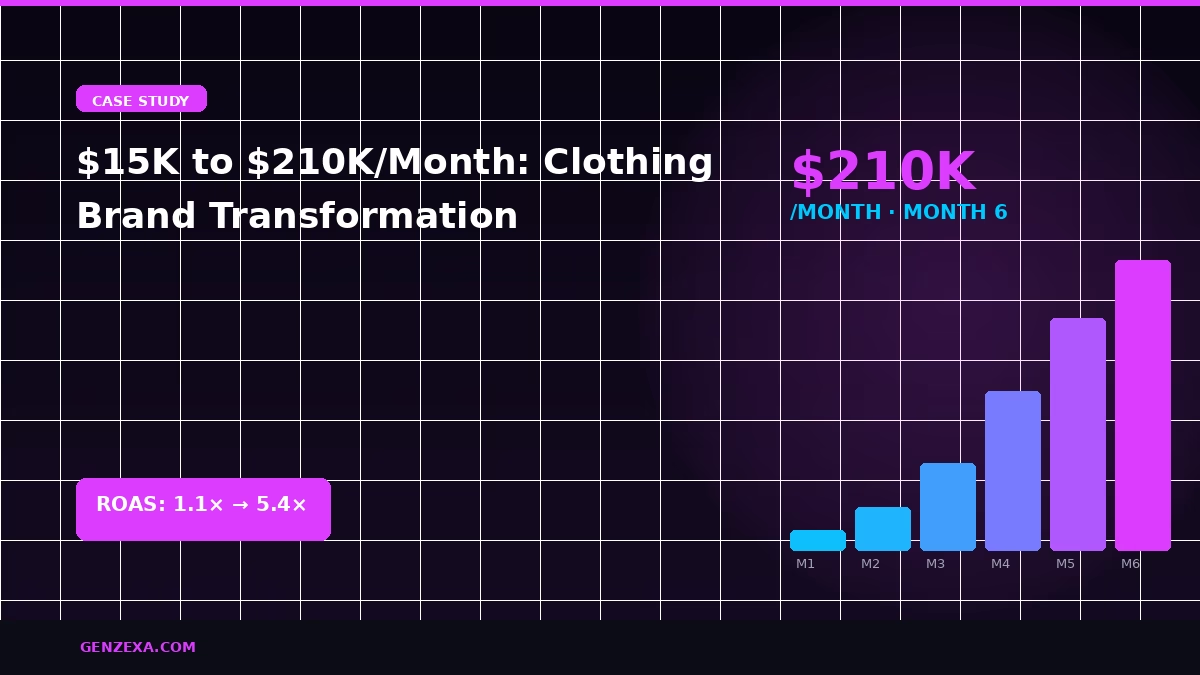
- Monthly revenue: $15,000 → $210,000
- ROAS: 1.1× → 5.4×
- Email revenue: $0 → $58,000/month (27% of total revenue)
- Repeat purchase rate: 18% → 41%
- Email list size: 0 → 24,000 active subscribers
- Website conversion rate: 0.8% → 3.1%
What This Took
Not magic. Not a viral moment. Not luck. Six months of disciplined, systematic execution: fixing the foundation, building the infrastructure, testing relentlessly, and compounding the wins. Every brand that does this work sees results. Most brands simply never do the work.
Reading about it is step one. We can do it for you.
Tell us what you sell and what's holding sales back. We'll tell you straight if we're the right people to fix it.
See all our case studies →